DeeperWebhooks
Webhooks overview in depth
Every control and text of Webhooks > Overview.
Every control and text this screen shows, in screen order. The list is read from the demo by a crawl, and CI fails when the screen changes without its entry here.
Webhooks > Overview shows how your endpoints are doing, computed from the delivery log each time you open it.
The screen as a whole: Webhooks.
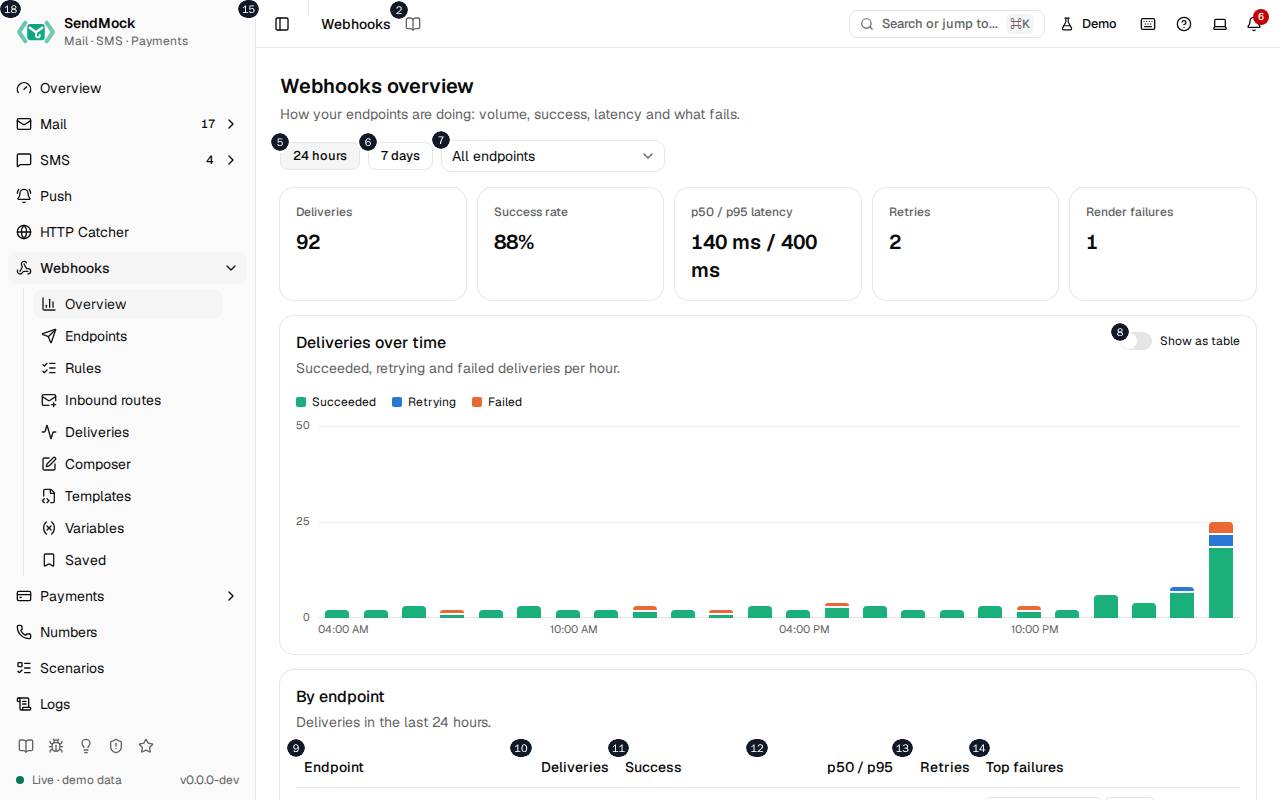
The numbers match the entries below. The picture shows the first screenful; controls further down, and texts, have no marker.
On the screen
1. Webhooks
Heading.
- What it does: Names the open screen in the header.
2. Read the Webhooks guide
Link.
- What it does: Opens this screen's page in the user guide, in a new tab.
- Links to: Webhooks.
3. Webhooks overview
Heading.
- What it does: The health of your webhook endpoints over the chosen time range.
- Same action elsewhere: REST
GET /api/v1/webhooks/metrics, CLIsendmock webhook metrics, MCPsendmock_webhook_metrics
4. How your endpoints are doing: volume, success, latency and what fails.
Text.
- What it does: Explains the screen.
5. # hours
Choice.
- What it does: Shows the last 24 hours, by hour.
- Same action elsewhere: REST
GET /api/v1/webhooks/metrics, CLIsendmock webhook metrics, MCPsendmock_webhook_metrics
6. # days
Choice.
- What it does: Shows the last 7 days, by day.
- Same action elsewhere: REST
GET /api/v1/webhooks/metrics, CLIsendmock webhook metrics, MCPsendmock_webhook_metrics
7. Endpoint
Drop-down.
- What it does: Shows every endpoint together, or one alone.
8. Show as table
Switch.
- What it does: Shows the deliveries chart as a table, one row per hour or day, for reading exact numbers.
9. Endpoint
Column.
- What it does: The endpoint's name.
10. Deliveries
Column.
- What it does: How many deliveries it had in the range.
11. Success
Column.
- What it does: The share of deliveries that ended answered 2xx.
12. p# / p#
Column.
- What it does: The median (p50) and 95th percentile (p95) time your endpoint took to answer.
13. Retries
Column.
- What it does: How many attempts were retries after a failure.
14. Top failures
Column.
- What it does: The failure codes it got most, such as
500or a timeout.
15. …
Button, in each row.
- What it does: The endpoint's name; shows only that endpoint on the screen.
16. …
Badge, in each row.
- What it does: The endpoint's success rate as a meter, or a label when it had no deliveries.
17. Open failed deliveries
Link.
- What it does: Opens Webhooks > Deliveries filtered to failed deliveries.
- Links to: Deliveries.
18. …
Link, in each row.
- What it does: A recent failed delivery, with its endpoint, code and time; opens it.
- Same action elsewhere: REST
GET /api/v1/webhooks/deliveries/{deliveryId}, CLIsendmock webhook deliveries show, MCPsendmock_webhook_delivery_get
Shown as a table
19. Hour
Column.
- What it does: The hour (or day) of the row.
20. Succeeded
Column.
- What it does: Deliveries answered 2xx.
21. Retrying
Column.
- What it does: Deliveries that failed and are waiting for a retry.
22. Failed
Column.
- What it does: Deliveries that failed every attempt.
23. Total
Column.
- What it does: All deliveries in the row.
24. p# latency
Column.
- What it does: The 95th percentile answer time in the row.
With no data yet
25. No deliveries yet
Text.
- What it does: Shown when no webhook has been delivered yet.
26. Deliveries show up here once a rule fires or you send a test to an endpoint.
Text.
- What it does: Explains how deliveries start.
27. Go to endpoints
Link.
- What it does: Opens Webhooks > Endpoints, to add one or send a test.
- Links to: Endpoints.
When the data cannot load
28. Could not load the webhook metrics. Try again
Message.
- What it does: Shown when the metrics could not be loaded.
- Errors: Check SendMock is running, then press Try again.
29. Could not load the webhook metrics.
Text.
- What it does: The message inside the alert.
30. Try again
Button.
- What it does: Loads the metrics again.
- Same action elsewhere: REST
GET /api/v1/webhooks/metrics, CLIsendmock webhook metrics, MCPsendmock_webhook_metrics