
Logs
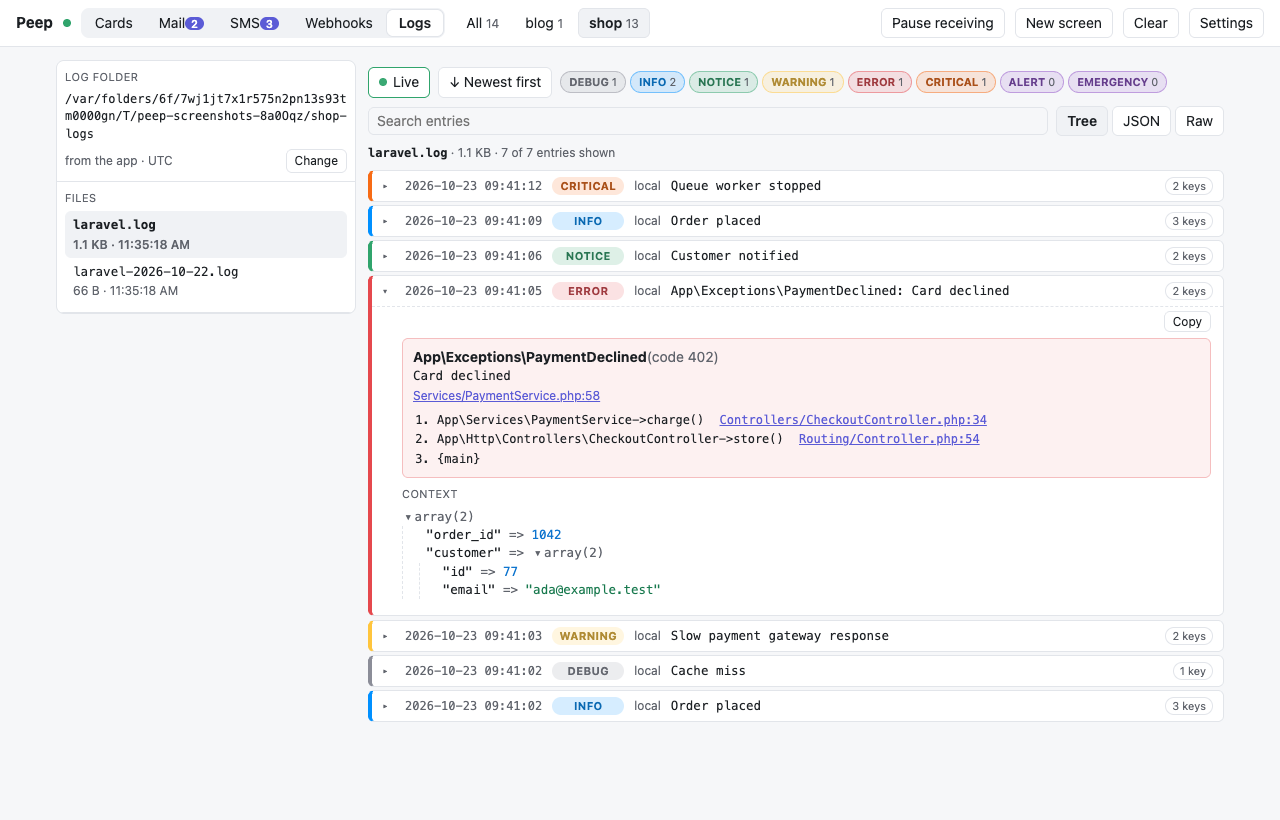
The Logs tab shows your app's log files (Laravel's storage/logs) as clean entries instead of raw text: a colored level, the time, the message, the exception with a clickable stack trace, and the context as a collapsible array or as JSON. You can watch a file live, pause it, and read it newest or oldest first.
Where the files come from
A Laravel app reports its log folder with every card it sends: storage/logs, mapped to your machine with PEEP_REMOTE_PATH and PEEP_LOCAL_PATH when it runs in Docker. So once the app has sent one card, its project appears in the Logs tab. The viewer reads the files from disk itself, so logs written before Peep was on show up too.
Choose another folder in the tab with Change (any app, any framework, as long as it writes Monolog's line format). Use app's goes back to the folder the app reports. The choice is kept in the viewer's settings.
An app that reports no folder (one running on the global install, or one that has not sent a card yet) can still be read: Add a log folder in the tab takes a folder and a project name. The name is filled in from the folder (shop for /Sites/shop/storage/logs); use the name the app sends its cards with, so cards and logs show together. Browse… picks the folder by clicking instead of typing: the desktop app opens the system's folder dialog, and in a browser the viewer shows its own folder picker (from your home folder, with Laravel apps marked and Use its storage/logs one click away).
| Setting | Does |
|---|---|
log_path in config/peep.php (PEEP_LOG_PATH) | Another folder than storage/logs; false reports none |
log_path, log_timezone in peep.php (PEEP_LOG_PATH, PEEP_LOG_TIMEZONE) | The same for apps without Laravel |
Times without an offset are read in the app's time zone (Laravel's app.timezone), so "since" filters and the agents' report line up with the cards.
Reading a file
- Pick the project in the toolbar (or in the tab when several have logs), then a file. The newest file opens by itself.
- Live shows new entries as they are written, about once a second; click it to pause. When the file is rotated or cleared, the view starts over.
- Newest first or Oldest first changes the order. Oldest first follows the end of the file while you are at the bottom.
- The level chips show how many entries each level has and hide or show them. Double-click one to see it and everything more severe (double-click error for errors, critical, alert and emergency).
- Search finds text anywhere in an entry, including its context and stack trace.
- Click an entry to open it. Tree shows the context as a collapsible array, JSON as pretty JSON, Raw exactly as written. Copy puts the raw entry on the clipboard.
- Big files open at once: the tab reads the newest 500 entries from the end of the file, and Load older entries reads the next ones.
| Level | Color |
|---|---|
| debug | gray |
| info | blue |
| notice | green |
| warning | yellow |
| error | red |
| critical | orange |
| alert, emergency | purple |
For AI agents
vendor/bin/peep logs and the MCP tool peep_logs give agents the same entries as text, and the debug report lists error-level log entries under Problems. See AI agents.
Safety
The viewer only lists and reads files ending in .log directly inside a project's folder, and only the viewer's own machine can ask for them, like the rest of the viewer page. The folder picker shows folder names and how many .log files a folder has, never other files, and only the viewer page can ask for it.