
Query debugging
Peep shows each database query with its bindings filled in, how long it took, and badges for slow queries and repeated (N+1) queries. You can turn query capture on and off from the viewer while your Laravel app runs, without touching code or restarting anything.
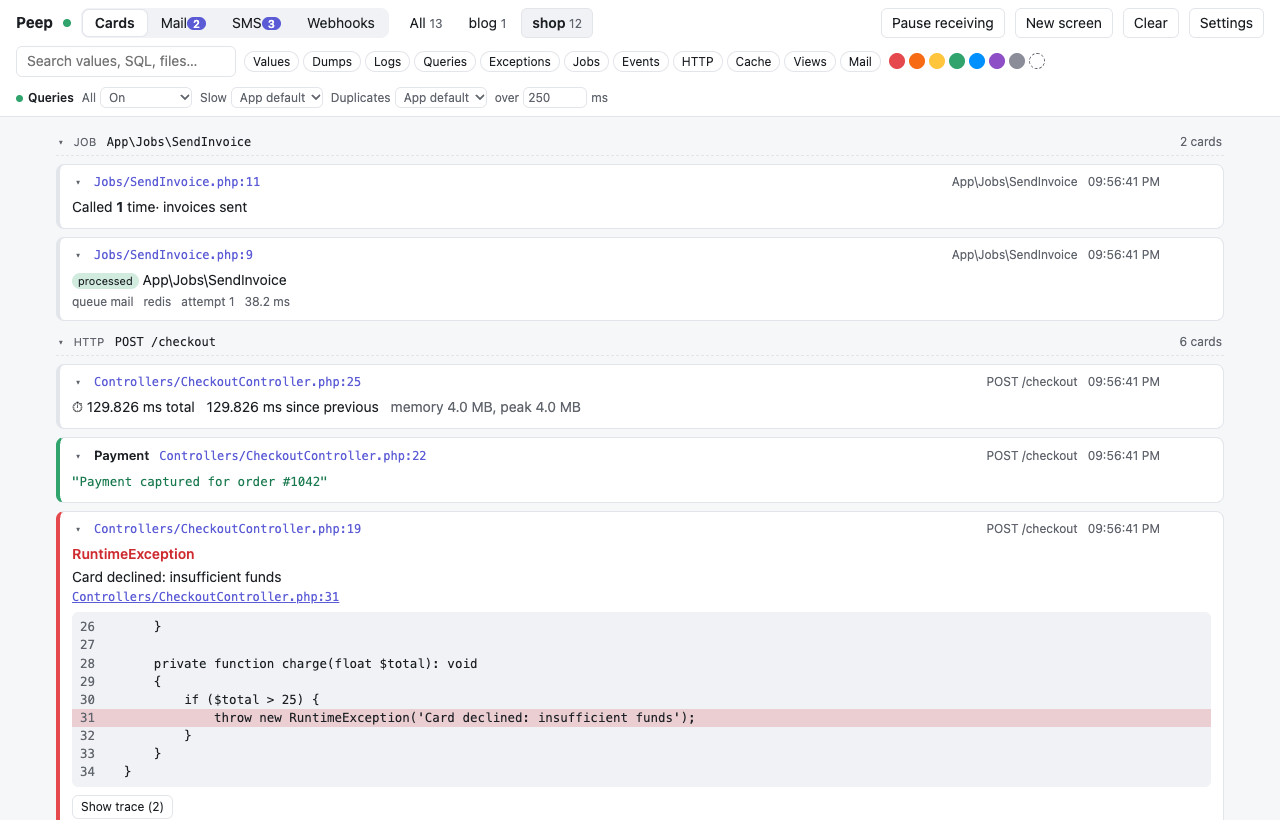
The switches
Select a project (or have only one), and the toolbar shows Queries:
| Switch | Does |
|---|---|
| All | Every query |
| Slow | Queries slower than the threshold in over ... ms (empty: the app's slow_query_ms) |
| Duplicates | Queries repeated within one request |
Each is App default (what config/peep.php says), On or Off. The dot next to Queries is green when all queries are on, red when they are off, and gray for the app's default.
How a running app picks it up
Every answer the viewer gives the app carries the switches, and the app asks again after five seconds of quiet, so a change reaches it within seconds.
From code
peep()->showQueries();                                   // from here on
peep()->showQueries(fn () => Order::with('items')->get()); // only inside, and returns the result
peep()->showSlowQueries(100);
peep()->showDuplicateQueries();
peep()->countQueries(fn () => $order->load('items'));    // how many queries, and their total time
User::where('active', true)->peep()->get();              // the SQL of one query builder
In config/peep.php: send_queries, query_types, send_slow_queries, slow_query_ms and send_duplicate_queries. The viewer's switches win over all of them while they are not App default.